Analysis of China Diesel Engine Market in Jan.-Sept. 2012 II
4. Sales data of diesel engines’ average power in 2004 – 2012
Chart Four: Sales data of diesel engines’ average power in 2004 – 2012
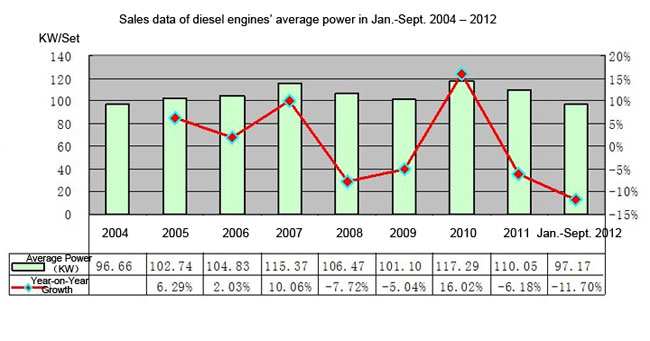
Chart Five: Monthly sales data of diesel engines’ average power in Jan.-Sept. 2011 & 2012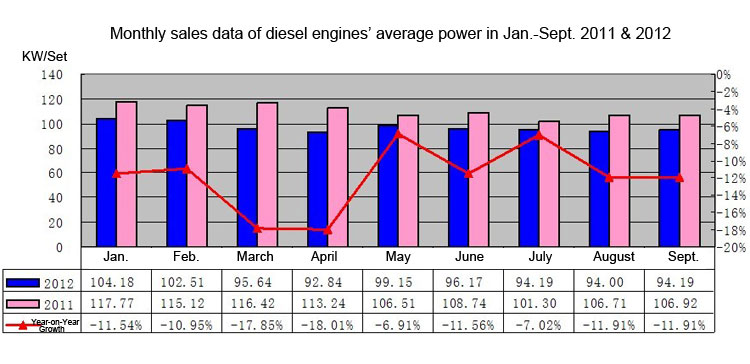
Part Two: General Factors Analysis on the Market of Diesel Engines in Jan.-Sept. 2011 & 2012
1. Sales data of various engine powers equipping in the commercial vehicles in 2006 - 2012
Table Two: Sales & market share data of various engine powers equipping in the CVs in 2006 – 2012
|
Diesel Engines equipped in the CVs
|
Gasoline Engines equipped in the CVs
|
Others equipped in the CVs
|
|||||||
|
Sales Volume
|
Year-on-year Growth
|
Market Share
|
Sales Volume
|
Year-on-year Growth
|
Market Share
|
Sales Volume
|
Year-on-year Growth
|
Market Share
|
|
|
2006
|
1618101
|
16.37
|
79.32
|
420138
|
6.64
|
20.59
|
1772
|
27.21
|
0.09
|
|
2007
|
1994576
|
23.27
|
79.98
|
497568
|
19.95
|
19.95
|
1846
|
4.18
|
0.07
|
|
2008
|
2132261
|
6.07
|
81.23
|
491096
|
1.90
|
18.71
|
1536
|
-16.79
|
0.06
|
|
2009
|
2693492
|
28.00
|
81.29
|
615097
|
29.55
|
18.56
|
4890
|
218.36
|
0.15
|
|
2010
|
3496075
|
29.80
|
81.23
|
800950
|
30.22
|
18.61
|
7117
|
45.54
|
0.17
|
|
2011
|
3300730
|
-5.59
|
81.85
|
720083
|
-10.10
|
17.86
|
11885
|
66.99
|
0.29
|
|
Jan.-Sept. 2012
|
2238092
|
-12.10
|
79.29
|
569656
|
5.00
|
20.18
|
14941
|
114.73
|
0.53
|
2. Sales data of various commercial vehicles in Jan.-Sept. 2012
Table Three: Sales & growth data of various commercial vehicles in Jan.-Sept. 2012
|
Sales Volume in 2012
|
Sales Volume in 2011
|
Year-on-year Growth
|
Market Share in CVs in Jan.-Sept. 2012
|
Market Share in CVs in Jan.-Sept. 2011
|
Growth Rate
|
|
|
Trucks
|
2452844
|
2739250
|
-10.46%
|
86.90%
|
88.49%
|
-1.59%
|
|
Heavy Trucks
|
491941
|
712036
|
-30.91%
|
17.43%
|
23.00%
|
-5.57%
|
|
Medium Trucks
|
201143
|
214653
|
-6.29%
|
7.13%
|
6.93%
|
0.19%
|
|
Light Trucks
|
1361728
|
1442793
|
-5.62%
|
48.24%
|
46.61%
|
1.64%
|
|
Micro Trucks
|
398032
|
369768
|
7.64%
|
14.10%
|
11.94%
|
2.16%
|
|
Heavy & Medium Trucks
|
693084
|
926689
|
-25.21%
|
24.55%
|
29.93%
|
-5.38%
|
|
Cargo Trucks
|
1961418
|
2075380
|
-5.49%
|
69.49%
|
67.04%
|
2.45%
|
|
Uncompleted vehicles
|
349232
|
465297
|
-24.94%
|
12.37%
|
15.03%
|
-2.66%
|
|
semi-trailer trucks
|
142194
|
198573
|
-28.39%
|
5.04%
|
6.41%
|
-1.38%
|
|
Buses
|
369845
|
356456
|
3.76%
|
13.10%
|
11.51%
|
1.59%
|
| Total of CVs |
2822689
|
3095706
|
-8.82%
|
100.00%
|
100.00%
|
0.00%
|
|
Traditional Trucks contains heavy trucks, medium trucks, light trucks and micro trucks. In the current trucks contains cargo trucks, uncompleted cargo trucks and semi-trailer trucks. |
||||||
- China’s First Ammonia Diesel Engine for Heavy Vehicle Ignited Successfully 2022-04-07
- China Sold 1,427,747 Units Diesel Engines in H1 2019 2019-07-26
- Shanghai Diesel Engine E Series Natural Gas Engine Passes State Tests 2019-06-04
- China to Replace 1 Million Outdated Diesel Trucks with Cleaner Ones by 2020 2019-01-17
- IAA 2018: Cummins Unveils the Future of Diesel with Low NOx and Low CO2 Emission 2018-09-20
- Cummins Rolls Out New Diesel Engine Products 2018-09-19
- Iran Khodro Diesel Launches Hyundai Trucks’ Assembly Line 2017-12-28
- JAC Euro V Diesel Pick-up Launched into Chile Market 2017-11-27
- The First SHACMAN Methanol Heavy Truck Launched in Kunshan CV Expo 2016-11-08
- Wuxi Diesel: Excellent Brand Lead to Hot Sales 2014-11-07
Submit Your Requirements, We Are Always At Your Service.
- SANY Accelerates Transition to Clean Energy
- FOTON Showcases Two EVs at Manila International Auto Show 2024
- Sinotruk and Shacman Aim to Promote Integrated Synergy in the Philippine Market
- Tan Xuguang: Sinotruk Aims to Build a World-Class High-End Brand in Vietnam
- Tan Xuguang: Tongli’s Heavy-duty Mining Truck Business is Our Benchmark
- Three FOTON Electric Trucks Launched in Indonesia
- FOTON Shines at 2024 China Automotive Brand Overseas (Chile) Touring exhibition
- US$80 Million! XCMG Announced Its Second Plant in Mexico
- FOTON Teams with Yierkeshtan Port to Promote “The Belt and Road”
- XCMG Listed in Forbes China's Globalization Innovators Selection 30&30


- China's Heavy Truck Exports Rising 58% YOY to 276,000 Units in 2023
- China Exported 507,000 Trucks from Jan.-Sept., Up 21% YoY
- China Exported 65,000 Trucks in July, Up 17% YoY
- Half Year Review of Commercial Vehicle Sales
- China Exported 63,000 Trucks in May, Up 33% YoY
- Top 10 Best-selling Battery-swapping Heavy Trucks in China in April
- China Exported 158,000 Trucks in Q1, Up 41% YoY
- China’s Truck Exports Grew by 43.8% YoY to 46600 Units in Feb., 2023
- China’s Heavy Truck Sales Rising 29% YOY to 77200 in Feb
- China Exports 567,000 Trucks in 2022, Hitting a New High in a Decade