Analysis of China Diesel Engine Market in Jan.-Sept. 2012 I
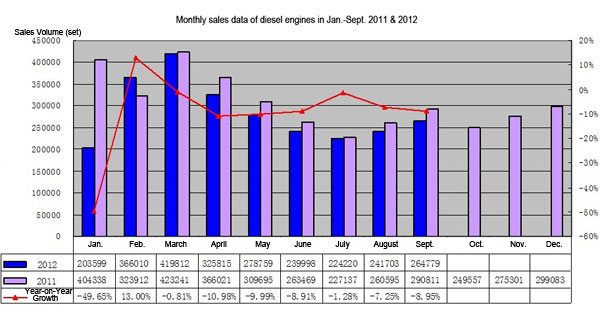
www.chinatrucks.com: According to China Association of Automobile Manufacturers statistical data showed that, 2.561 million diesel engines were sold in Jan.-Sept. 2012, which decreased by 11.14 percent comparing to the same period in Jan.-Sept. 2011.
Part One: General Monthly Sales Data on the Market of Diesel Engines in Jan.-Sept. 2011 & 2012
1. Monthly sales data of diesel engines in Jan.-Sept. 2011 & 2012
Chart One: Monthly sales data of diesel engines in Jan.-Sept. 2011 & 2012
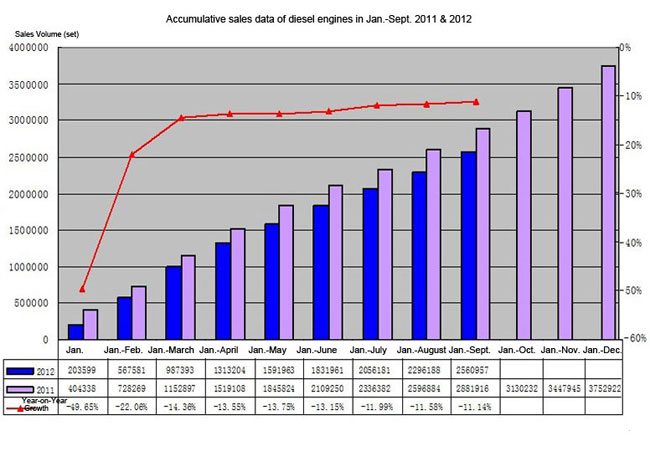
2. Accumulative sales data of diesel engines in Jan.-Sept. 2011 & 2012
Chart Two: Accumulative sales data of diesel engines in Jan.-Sept. 2011 & 2012
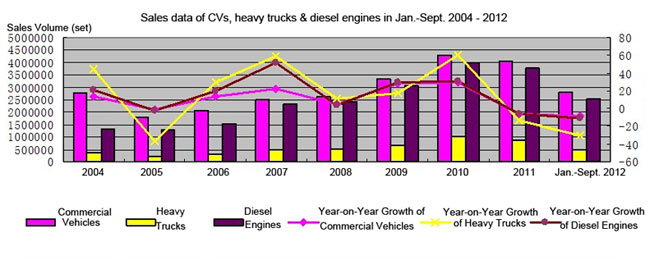
3. Sales analysis of commercial vehicles, heavy trucks & diesel engines in Jan.-Sept. 2004 – 2012
In current China auto markets, most of the commercial vehicles are equipping with diesel engines, in Jan. - Sept. 2012, the market share of diesel commercial vehicles was 79.29 percent, but market share of diesel car was 0.56 percent. So the sales volume of the diesel engine should change with the sales growth of the commercial vehicles. By the influence of the macro economy in China, the heavy truck market volatility is very big, but the market of the medium trucks, light trucks, micro trucks and the buses amplitude comparatively small.
Table One: Sales data of CVs, heavy trucks & diesel engines in 2004 - 2012
,
|
|
2004
|
2005
|
2006
|
2007
|
2008
|
2009
|
2010
|
2011
|
Jan.-Sept. 2012
|
|
|
Commercial Vehicles
|
Sales Volume (set)
|
2744569
|
1787088
|
2040106
|
2493990
|
2624893
|
3313479
|
4304142
|
4032698
|
2822689
|
|
Year-on-Year Growth
|
13.45
|
-0.75
|
14.16
|
22.25
|
5.25
|
28.39
|
29.90
|
-6.31
|
-8.82
|
|
|
Heavy Trucks
|
Sales Volume (set)
|
370795
|
236586
|
307296
|
487481
|
540448
|
636171
|
1017433
|
880641
|
491941
|
|
Year-on-Year Growth
|
44.98
|
-36.19
|
29.89
|
58.64
|
10.87
|
17.71
|
59.93
|
-13.44
|
-30.91
|
|
|
Diesel Engines
|
Sales Volume (set)
|
1305205
|
1272536
|
1530440
|
2320410
|
2396986
|
3051301
|
3992674
|
3752922
|
2560957
|
|
Year-on-Year Growth
|
21.49
|
-2.50
|
20.27
|
51.62
|
3.30
|
29.91
|
30.36
|
-5.89
|
-11.14
|
Chart Three: Sales data of CVs, heavy trucks & diesel engines in 2004 - 2012
- China’s First Ammonia Diesel Engine for Heavy Vehicle Ignited Successfully 2022-04-07
- China Sold 1,427,747 Units Diesel Engines in H1 2019 2019-07-26
- Shanghai Diesel Engine E Series Natural Gas Engine Passes State Tests 2019-06-04
- China to Replace 1 Million Outdated Diesel Trucks with Cleaner Ones by 2020 2019-01-17
- IAA 2018: Cummins Unveils the Future of Diesel with Low NOx and Low CO2 Emission 2018-09-20
- Cummins Rolls Out New Diesel Engine Products 2018-09-19
- Iran Khodro Diesel Launches Hyundai Trucks’ Assembly Line 2017-12-28
- JAC Euro V Diesel Pick-up Launched into Chile Market 2017-11-27
- The First SHACMAN Methanol Heavy Truck Launched in Kunshan CV Expo 2016-11-08
- Wuxi Diesel: Excellent Brand Lead to Hot Sales 2014-11-07
Submit Your Requirements, We Are Always At Your Service.
- Welcome to FOTON’S Open Day 2024
- SHACMAN Showcased at LOGISTICS WORLD SUMMIT & EXPO 2024 in Mexico
- Invitation to Visit: 2025 China Commercial Vehicle Show (CCVS)
- SANY Accelerates Transition to Clean Energy
- FOTON Showcases Two EVs at Manila International Auto Show 2024
- Sinotruk and Shacman Aim to Promote Integrated Synergy in the Philippine Market
- Tan Xuguang: Sinotruk Aims to Build a World-Class High-End Brand in Vietnam
- Tan Xuguang: Tongli’s Heavy-duty Mining Truck Business is Our Benchmark
- Three FOTON Electric Trucks Launched in Indonesia
- FOTON Shines at 2024 China Automotive Brand Overseas (Chile) Touring exhibition


- China's Heavy Truck Exports Rising 58% YOY to 276,000 Units in 2023
- China Exported 507,000 Trucks from Jan.-Sept., Up 21% YoY
- China Exported 65,000 Trucks in July, Up 17% YoY
- Half Year Review of Commercial Vehicle Sales
- China Exported 63,000 Trucks in May, Up 33% YoY
- Top 10 Best-selling Battery-swapping Heavy Trucks in China in April
- China Exported 158,000 Trucks in Q1, Up 41% YoY
- China’s Truck Exports Grew by 43.8% YoY to 46600 Units in Feb., 2023
- China’s Heavy Truck Sales Rising 29% YOY to 77200 in Feb
- China Exports 567,000 Trucks in 2022, Hitting a New High in a Decade