Analysis and Anticipation on Heavy Duty Truck Market in Q3
1. Macro economic factors effecting the development of Chinese commercial trucks in the first three quarters of 2013
We will continue to focus on several highly relevant indexes. In the first three quarters of 2013, four factors are concluded having exerted impact on all kinds of commercial trucks: market factors effecting dumpers and special vehicles, market factors effecting road logistic vehicles, factors effect users’ purchasing capability and factors effecting users’ operation.
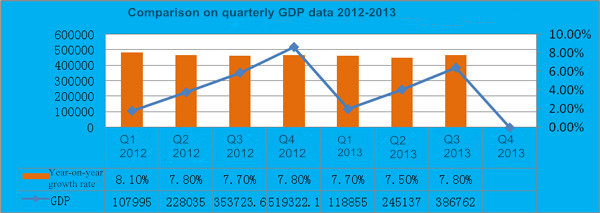
1) In the first three quarters, the national GDP is 38,676.2 billion yuan, up by 7.7% over last year. In Q1 the GDP grows by 7.7%, Q2 up by 7.5% and Q3 up by 7.8%. Seen from the industries, the added value of the first industry is 3,566.9 billion yuan, up by 3.4% year on year; that of the secondary industry is 17,511.8 billion yuan, up by 7.8% year on year; that of the third industry is 17,597.5 billion yuan, up by 8.4% year on year. If comparison is made on a quarterly basis, it is found that in Q3 the economic recovery starts to be quite obvious due to GDP up by 2.2% year on year.
Chart 2: GDP and growth rate in first three quarters
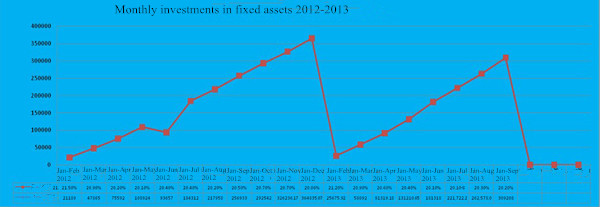
2) Investment in fixed asset: in the first three quarters, the investment in fixed asset (excluding rural residents) totals 30,920.8 billion yuan, up by 20.2% year on year (deducting price factors), and the growth rate is 0.1 percentage higher than that in the first half year. Chinese state owned and state-owned holding investment amounts to 9900.1 billion yuan, up by 17.6%; the private investment amounts to 19661.1 billion yuan, up by 23.3%.
Chart 3 Monthly investments in fixed assets
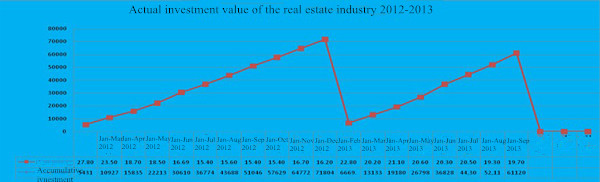
3) Investment in the real estate: in the first three quarters, the investment is 6112 billion yuan, up by 19.7% year on year (deducting price factors), and the growth rate drops 0.6 percentage than that in the first half year. The investment in housing grows by 19.5%, 1.3 percentage lower than that in the first half year. The newly constructed house area is 1.449 billion square meters, rising by 7.3% year on year, the newly constructed residence area increases by 6.4%.
Chart 4: Actual development value in the real estate industry
4) Highway freight volume index and rotation volume of freight transport index in first three quarters of 2013
4.1) Highway freight volume index
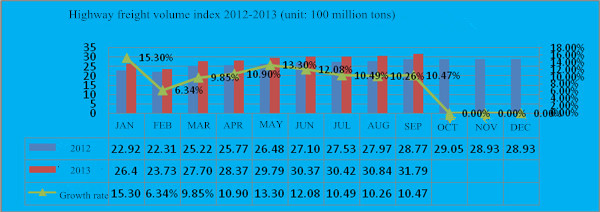
From January to September, the highway freight volume is 25.8283 billion tons, up by 11.1% year on year. The growth rate suffers a big decline compared to the average growth rate of 2012 (14.465%). Seen from the single month, the growth rate in September is 10.47%, indicating a remaining slump freight market.
Chart 5 Highway freight volume index
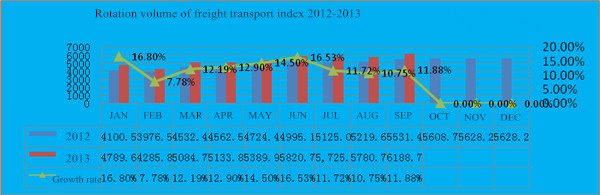
4.2) Rotation volume of freight transport: in the first three quarters of 2013, the rotation volume of freight transport is 4802.9 billion tons, up by 12.3% year on year. The growth rate drops compared to that in the whole 2012 (16.89%). Seen from the single month, in September, the growth rate is only 11.88%, indicating a low freight transport volume.
Chart 6 Rotation volume of freight transport index
5) Money supply from central bank in the first eight months of 2013
At the end of September, the balance of M2 is 107.74 trillion yuan, up by 14.2% year on year, and the growth rate drops 0.5 percentage compared to last month. The balance of M1 is 31.23 trillion yuan, up by 8.9% year on year and the grow rate drops 1.0 percentage compared to last month. At the end of September, the loan balance of RMB is 70.28 trillion yuan, and the balance of RMB deposits is 103.09 trillion yuan. In the first three quarters, the new RMB loan is 7.28 trillion yuan, 557 billion yuan more compared to the same period of last year; new deposit is 11.27 trillion yuan, 2.23 trillion yuan more compared to the same period of last year.
Data in August from the central bank
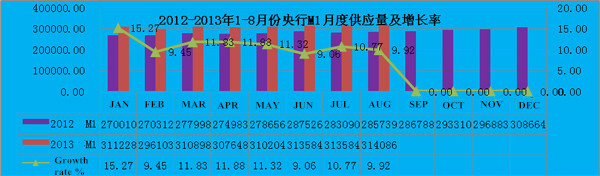
5.1) M1 supply: M1=M0+current deports (current deposits of enterprises + organizations and troops + rural area + individual credit). M1 represents the instant purchasing power. The average growth rate in the first eight months is 11.19%; and the average growth rate in 2012 is 4.80%.
Chart 7 Monthly supply of M1 from January to August 2012-2013
5.2 Supply of M2 from central bank
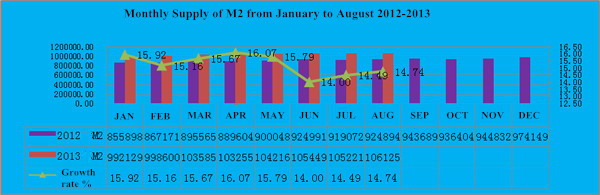
M2=M1+deposits of urban and rural residents + fixed deposits of enterprises + deposits of entrust + other deposits. M2 reflects the potential purchasing power. From January to August, 2013, the average growth rate is 15.23%; and the average growth rate of 2012 is 17.256%.
Chart 8 Monthly Supply of M2 from January to August 2012-2013
Based on the growth rates of M1 and M2, we could enter the following conclusion according to market liquidity that the market capital is relatively abundant, thus providing a fiscal support to the purchasing power in the second quarter.
2. Overall trend in the first three quarters in 2013
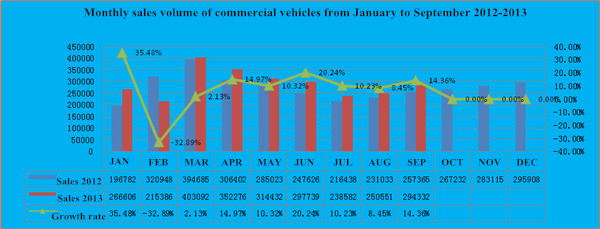
According to statistics of CAAM, from January to September 2013, all Chinese automotive manufacturers (77 enterprises) produce a total of 15938351 units, up by 12.78% over the same period of last year (14131795 units). The sales volume of the 77 enterprises totals 15883084 units, up by 12.7% over the same period of last year (14092641 units). Production of commercial trucks (heavy, medium, light and micro trucks) is 2608433 units, up by 8.0% over the same period of last year (2395264 units). Sales volume of commercial trucks is 2633069 units, up by 7.33% over the same period of last year (2453188 units). The sales volume of heavy trucks is 567209, up by 15.3% year on year; that of medium trucks is 221804 units, up by 10.27%; that of light trucks 1441735 units, up by 5.85% year on year; and that of micro trucks 402321 units, up by 1.08% year on year.
Chart 1 Monthly sales volume of commercial vehicles from January to September 2012-2013
3. Heavy truck market in first three quarters 2013: upturn in “golden” September
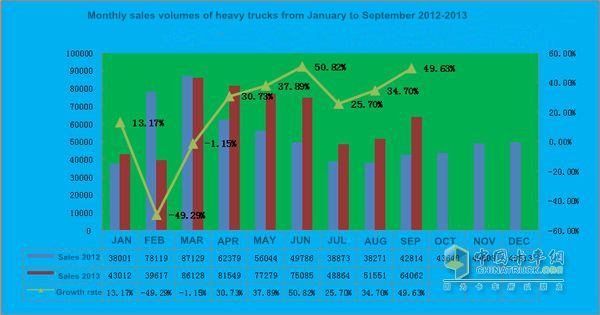
Statistics from CAAM show that in September, the sales volume of heavy trucks is 64062 units, up by 49.63% year on year and 24.27% over last month. From January to September, the production accumulates 557704 units, up by 22.55% year on year; the sales volume accumulates 567209 units, up by 15.3% over the same period of last year (491941 units). Seen from monthly sales volume, September remains a “golden month” like always.
Chart 9 Monthly sales volumes of heavy trucks from January to September 2012-2013
4. Sales of specific truck types in the first three quarters of 2013
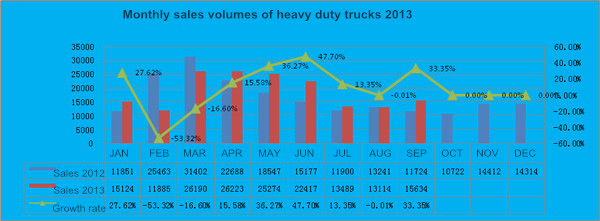
1) Heavy duty trucks: the heavy duty truck market grows slowly with a rate lower than the average truck industry. However, seen from the single month sales, in September, this market gets a rapid increase. From January to September, all 4 truck types (including micro, light, medium and heavy trucks) witness a total sales volume of 2073932 units, up by 5.71% over the same period of last year (1961831 units). The sales volume of heavy trucks accumulates to be 169461 units, up by 4.43% over the same period of last year (162279 units).
Chart 10 Monthly sales volumes of heavy duty trucks 2013
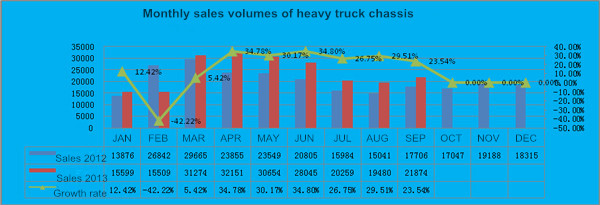
2) Heavy truck chassis market: relatively stable growth
From January to September, 2013, chassis for all 4 types of trucks (micro, light, medium and heavy trucks) witness a sales volume of 376280 units, up by 7.75% over the same period of last year (349213 units). The heavy truck chassis accumulates to sell 214891 units, up by 14.6% over the same period of last year (187518 units). Seen from monthly sales, the chassis market basically maintains a steady growing trend.
Chart 11 Monthly sales volumes of heavy truck chassis
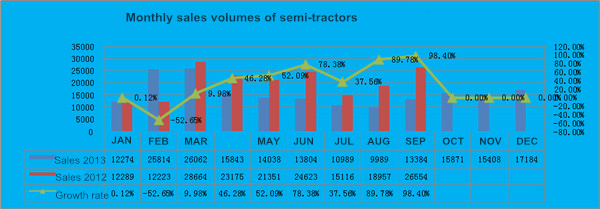
3) Semi-tractors: heated sales in the “golden September”
In September, the sales volume of semi-tractors hits 26103 units, up by 103.91% year on year and 30.76% over last month. The accumulative sales volume from January to September is 184077 units, up by 34.15% over the same period of last year (137222 units). Seen from the monthly sales volume, April sees a big growth rate.
Chart 12 Monthly sales volumes of semi-tractors
5. Market share of major heavy truck manufacturers in the first three quarters
1) Top five manufacturers
In September, the top five heavy truck manufacturers are Dongfeng, FAW, Sinotruck, Foton and Shacman.
2) Other enterprises with good sales in the first three quarters
In September, other enterprises which enjoy good sales include: SAIC-IVECO HONGYAN (growth rate over 59%), CAMC (growth rate 55%) and XCMG (growth rate 56%).
Chart 13 Heavy duty truck market patterns in Q1
|
Sales volume and market share of heavy duty truck manufacturers from January to September 2013
|
|||||||
|
Name
|
Sales in SEP
|
Sales from JAN to SEP
|
Growth rate over last month
|
Growth rate over last year %
|
Growth rate (accumulative) %
|
Share in SEP
|
Accumulative share
|
|
Heavy duty trucks
|
64062
|
567209
|
24.27
|
49.63
|
15.30
|
100.00%
|
100.00%
|
|
Dongfeng
|
14899
|
118933
|
84.05
|
70.92
|
14.25
|
23.26%
|
20.97%
|
|
FAW
|
12649
|
95649
|
26.09
|
71.91
|
18.38
|
19.74%
|
16.86%
|
|
Sinotruk
|
9006
|
89989
|
0.04
|
30.39
|
5.13
|
14.06%
|
15.87%
|
|
Foton
|
10248
|
84188
|
20.86
|
47.58
|
28.88
|
16.00%
|
14.84%
|
|
Shacman
|
7179
|
73594
|
4.19
|
49.78
|
13.21
|
11.21%
|
12.97%
|
|
JAC
|
2415
|
24552
|
9.42
|
7.72
|
23.38
|
3.77%
|
4.33%
|
|
SAIC-IVECO HONGYAN
|
1701
|
19709
|
1.86
|
47.40
|
59.85
|
2.66%
|
3.47%
|
|
CAMC
|
1629
|
18124
|
6.75
|
55.59
|
55.14
|
2.54%
|
3.20%
|
|
Baotou Beiben
|
1317
|
14606
|
16.45
|
9.29
|
-24.97
|
2.06%
|
2.58%
|
|
Chengdu Dayun
|
756
|
8957
|
27.06
|
48.82
|
44.28
|
1.18%
|
1.58%
|
|
Hubei Tri-Ring Special Purpose Vehicle
|
417
|
4164
|
15.83
|
13.01
|
-15.62
|
0.65%
|
0.73%
|
|
GAC HINO
|
421
|
3033
|
58.27
|
28.35
|
-27.02
|
0.66%
|
0.53%
|
|
Zhejiang Feidie
|
375
|
2616
|
13.98
|
-22.20
|
-30.11
|
0.59%
|
0.46%
|
|
XCMG
|
236
|
2789
|
-23.87
|
43.03
|
56.86
|
0.37%
|
0.49%
|
|
Jingdong Zhenjiang
|
145
|
1466
|
-2.03
|
6.62
|
-8.20
|
0.23%
|
0.26%
|
|
Qingling
|
414
|
1768
|
71.07
|
143.53
|
39.65
|
0.65%
|
0.31%
|
|
YTO
|
133
|
1101
|
4.72
|
|
|
0.21%
|
0.19%
|
|
Sichuan Hyundai
|
72
|
689
|
33.33
|
-51.68
|
-57.91
|
0.11%
|
0.12%
|
|
JMC
|
13
|
339
|
8.33
|
-23.53
|
-31.79
|
0.02%
|
0.06%
|
|
Shandong KAMA
|
20
|
415
|
-47.37
|
-67.74
|
-60.33
|
0.03%
|
0.07%
|
|
Fujian New Long Ma Motor
|
0
|
207
|
|
-100
|
-48.51
|
0.00%
|
0.04%
|
|
Hubei Sanjiang Space Wanshan Special Vehicle
|
9
|
192
|
50.00
|
-47.06
|
-20.00
|
0.01%
|
0.03%
|
|
Hebei Changzheng
|
7
|
60
|
-12.50
|
75.00
|
5.26
|
0.01%
|
0.01%
|
|
Hubei Hanyang Tri-Ring Special Purpose Vehicle
|
1
|
59
|
-95.45
|
-91.67
|
-37.89
|
0.00%
|
0.01%
|
|
Dandong Huanghai
|
0
|
10
|
-100
|
0
|
233.33
|
0.00%
|
0.00%
|
6. Q4 anticipation: the overall demand is around 155,900 units
1) Favorable factors: in the next stage, the whole industry needs to carry out the central government’s decision and arrangement to further promote the reform and opening-up, adjust structure, and stimulate the market vitality and internal drive so as to boost the healthy development of Chinese economy.
In the first three quarters, the national GDP is 38,676.2 billion yuan, up by 7.7% over last year. In Q1 the GDP grows by 7.7%, Q2 up by 7.5% and Q3 up by 7.8%. Seen from the industries, the added value of the first industry is 3,566.9 billion yuan, up by 3.4% year on year; that of the secondary industry is 17,511.8 billion yuan, up by 7.8% year on year; that of the third industry is 17,597.5 billion yuan, up by 8.4% year on year. If comparison is made on a quarterly basis, it is found that in Q3 the economic recovery starts to be quite obvious due to GDP up by 2.2% year on year.
In September, 2013, the PMI of Chinese manufacturing industry is 51.1%, up by 0.1 percentage point over last month, another rise in three consecutive months.
2) Anticipation on demands in Q4: based on the above mentioned factors, in the Q4 2013, the demand for heavy trucks will slightly go down especially dumper and special vehicle markets. The tractor and cargo truck markets might maintain the stable growing trend but are still possible to decline. Hence, it is concluded that the demand for heavy trucks in Q4 is around 155,900 units.
- Shandong Heavy Industry Group, ARUN PLUS Promote New Energy Reform in Thailand 2024-04-12
- Shandong Heavy Industry,Orix Group Continue to Expand Cooperation 2024-02-23
- China's Heavy Truck Exports Rising 58% YOY to 276,000 Units in 2023 2024-02-21
- Shandong Heavy Industry Group Global Partner Conference Held in Dubai 2023-11-30
- Jiefang J7, the Most Popular Heavy-duty Truck 2023-05-17
- Sales of New Energy Heavy-duty Truck Sales On Rise in September 2022-10-17
- SANY Launches 13 Electric Tractors and World’s First MTB Battery 2022-09-27
- Daimler Truck Starts Local Production of Mercedes-Benz Branded Trucks in China 2022-09-26
- Volvo Trucks Starts Series Production of Heavy Electric Trucks 2022-09-15
- China's Truck Exports Grew by 54% YOY to 48700 Units in July 2022-09-06
Submit Your Requirements, We Are Always At Your Service.
- SHACMAN Showcased at LOGISTICS WORLD SUMMIT & EXPO 2024 in Mexico
- Invitation to Visit: 2025 China Commercial Vehicle Show (CCVS)
- SANY Accelerates Transition to Clean Energy
- FOTON Showcases Two EVs at Manila International Auto Show 2024
- Sinotruk and Shacman Aim to Promote Integrated Synergy in the Philippine Market
- Tan Xuguang: Sinotruk Aims to Build a World-Class High-End Brand in Vietnam
- Tan Xuguang: Tongli’s Heavy-duty Mining Truck Business is Our Benchmark
- Three FOTON Electric Trucks Launched in Indonesia
- FOTON Shines at 2024 China Automotive Brand Overseas (Chile) Touring exhibition
- US$80 Million! XCMG Announced Its Second Plant in Mexico


- China's Heavy Truck Exports Rising 58% YOY to 276,000 Units in 2023
- China Exported 507,000 Trucks from Jan.-Sept., Up 21% YoY
- China Exported 65,000 Trucks in July, Up 17% YoY
- Half Year Review of Commercial Vehicle Sales
- China Exported 63,000 Trucks in May, Up 33% YoY
- Top 10 Best-selling Battery-swapping Heavy Trucks in China in April
- China Exported 158,000 Trucks in Q1, Up 41% YoY
- China’s Truck Exports Grew by 43.8% YoY to 46600 Units in Feb., 2023
- China’s Heavy Truck Sales Rising 29% YOY to 77200 in Feb
- China Exports 567,000 Trucks in 2022, Hitting a New High in a Decade